Understanding Trading View: Features and Benefits for Traders
In the fast-paced world of financial trading, having access to robust, real-time market data and analysis tools is crucial for making informed decisions. Trading view has emerged as a leading platform that meets these demands, offering traders a comprehensive suite of tools to analyze, chart, and trade across multiple markets seamlessly. Whether you’re a beginner exploring the fundamentals or an experienced trader executing complex strategies, understanding the core features and benefits of Trading View can significantly enhance your trading performance.
Overview of Trading View’s Core Tools
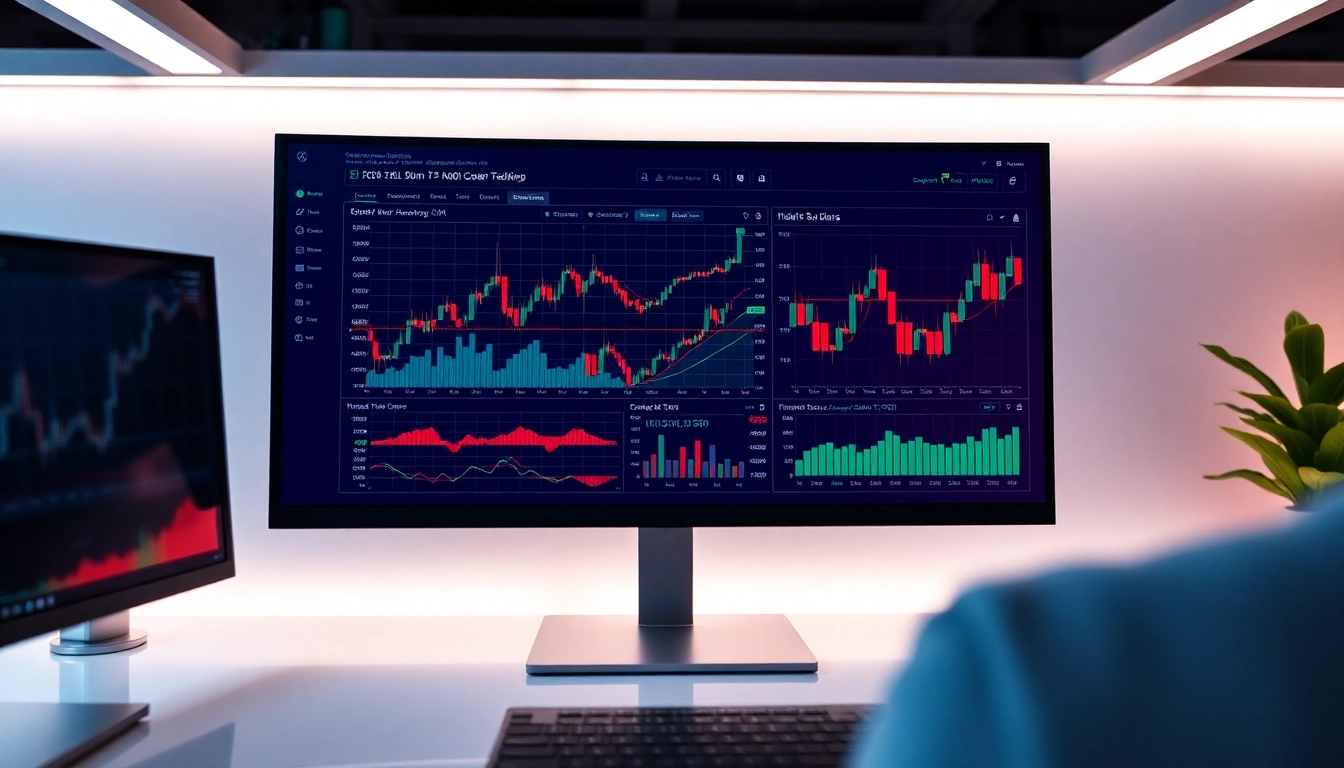
Trading View distinguishes itself through its versatile core tools designed for market analysis and trading automation. At its heart are advanced charts capable of rendering a broad spectrum of technical indicators, trend lines, and pattern recognition features. The platform supports a multitude of chart types—including candlestick, bar, line, and Renko charts—allowing traders to analyze price action in various formats suitable for their strategies.
Furthermore, Trading View integrates a powerful stock screener and market scanner that enables traders to filter assets based on specific criteria such as volume, volatility, moving averages, and technical indicators. This functionality streamlines the research process, helping traders identify promising opportunities quickly. The platform also offers real-time data feeds across stocks, cryptocurrencies, Forex, commodities, and indices, ensuring that analysis reflects current market conditions.
Advantages of Using Trading View for Market Analysis
One of the key advantages of Trading View is its social component, which creates a vibrant community of traders sharing ideas, strategies, and insights. This collaborative environment fosters learning and enhances analytical depth through shared community ideas and beginner-to-advanced tutorials.
Additionally, Trading View’s cloud-based architecture allows users to access their setups from anywhere and on any device—desktop, tablet, or mobile—without the need for heavy software installation. Its intuitive interface and extensive customization options mean traders can develop tailored dashboards that suit their trading styles and preferences.
In terms of analytical depth, the platform offers over 100 built-in technical indicators, oscillators, and drawing tools. Users can combine multiple indicators to create robust trading signals and confirm entries or exits. The platform’s ability to synchronize real-time data with historical charts facilitates effective backtesting of strategies, which is essential for validating trading hypotheses before risking capital.
How Trading View Facilitates Informed Trading Decisions
Trading View’s comprehensive analytical environment empowers traders to make more informed decisions by presenting data visually and interactively. Features such as customizable alerts notify traders about significant price movements, indicator crossovers, or pattern formations, ensuring timely actions.
For instance, traders can set alerts on moving average crossovers or Fibonacci retracements; when these events occur, they receive instant notifications. This minimizes missed opportunities and reduces reliance on constant manual monitoring. Furthermore, the platform’s community ideas area provides a diverse pool of insights from traders worldwide, allowing users to gauge market sentiment and incorporate different perspectives into their analysis.
Coupled with its ability to simulate trading strategies directly on charts, Trading View offers a comprehensive environment for understanding potential outcomes before executing trades. This risk mitigation approach enhances traders’ confidence and helps optimize trade entries and exits aligned with their risk management plans.
Getting Started with Trading View: Setup and Customization
Creating and Customizing Your Trading Dashboard
Getting started involves creating a free account on Trading View, which unlocks access to a broad range of tools and community features. Post-registration, users can personalize their dashboards by arranging charts, watchlists, news feeds, and social streams according to their preferences.
For example, traders can set up multiple charts side by side, apply different technical setups, and save these layouts for quick access. Customizing color schemes and indicator panels not only enhances visual clarity but also helps in rapid decision-making during live trading sessions.
Integrating Alerts and Notifications for Timely Decisions
Alerts are vital tools for maintaining situational awareness without constant manual oversight. Trading View allows traders to specify conditions like price levels, indicator values, or pattern formations that trigger alerts via pop-ups, emails, or push notifications on mobile devices.
To set an alert, simply right-click on a chart element or use the alert menu, define your criteria, and choose your notification method. Properly utilized, alerts can automate part of your monitoring process, freeing your attention for strategic analysis and execution.
Exploring Chart Types and Technical Indicators
Understanding the different chart types enhances analysis accuracy. Candlestick charts, for example, provide detailed information about opening, closing, high, and low prices, ideal for pattern recognition. Line charts, on the other hand, provide a simplified trend view, suitable for long-term analysis.
Techniques such as overlaying moving averages, Bollinger Bands, RSI, MACD, and Fibonacci retracement lines can help traders locate entry and exit points, gauge trend strength, and anticipate reversals. Trading View’s extensive library of indicators and the ability to create custom scripts further expand analytical possibilities.
Advanced Trading Strategies Using Trading View
Utilizing Technical Analysis and Pattern Recognition
Advanced traders leverage Trading View’s pattern recognition tools to identify formations like head and shoulders, double tops/bottoms, and pennants. Recognizing these patterns early can offer high-probability trading opportunities.
Backtesting these patterns using historical data on the platform helps validate their predictive power and refine entry and exit rules. Combining multiple pattern signals with momentum oscillators enhances decision accuracy in dynamic markets.
Implementing Automated Alerts and Trading Scripts
Trading View supports Pine Script, its proprietary scripting language, which allows traders to develop automated indicators and trading strategies. This capability enables the creation of alerts based on complex multi-condition algorithms, reducing manual analysis and increasing efficiency.
For example, a trader might script an alert that triggers when RSI indicates oversold conditions while price hits a Fibonacci support level, signaling an optimal buy opportunity. Automation fosters disciplined trading and helps manage emotional biases.
Combining Social Ideas and Community Insights
The social feature of Trading View is invaluable for gathering collective market intelligence. Traders share ideas, forecasts, and setups, which can serve as supplementary confirmation or challenge existing analysis.
Following successful traders and participating in community discussions can enhance learning curves and diversify perspectives—especially useful for emerging traders seeking mentorship or advanced traders seeking new strategies.
Optimizing Trading View Performance for Better Results
Best Practices for Efficient Market Monitoring
To maximize efficiency, traders should develop a focused watchlist tailored to their preferred assets and timeframes. Regularly updating filters and scanning settings ensures relevant market movements are captured without information overload.
Utilizing keyboard shortcuts, keyboard macros, and layout presets speeds up analysis workflows, leading to quicker decision-making in volatile markets.
Enhancing Your Trading Strategies with Data Analytics
Advanced traders often analyze historical performance metrics by exporting data or integrating with third-party analytics tools. Combining Trading View’s chart data with statistical analysis enables the identification of performance patterns, success rates, and areas needing refinement.
Periodic review of your trading ideas and their outcomes fosters a data-driven approach, improving strategy robustness and accountability.
Tracking Performance Metrics and Refining Tactics
Trading View provides features to track your trading performance via manual logging or linked account analysis. Monitoring metrics such as win/loss ratio, average profit/loss, and maximum drawdown guides strategic adjustments and risk management enhancements.
Consistent evaluation of trading tactics within the platform ensures continuous improvement and adaptation to evolving market conditions.
Future Trends and Opportunities in Trading Visualization
The Impact of AI and Machine Learning on Trading Platforms
Emerging AI-driven features in platforms like Trading View include predictive analytics, sentiment analysis, and adaptive indicators that evolve with market volatility. These tools aim to automate complex analysis and generate trading signals with higher accuracy.
Emerging Features and Innovations in Trading View
Future enhancements may encompass more integrated trading execution capabilities, deeper customization of scripting, and richer social collaboration tools, expanding the platform’s utility for different trading styles.
Integrating Trading View with Broader Financial Tools
Seamless integration with brokerage platforms, portfolio management software, and data analytics suites will further empower traders with holistic views of their investments, facilitating better asset allocation and risk assessment.